i7242 | Xingyu Yan 一吃一大碗, 一睡一整天
K-means Clustering
Assumptions
This is just an implementation of K-means algorithm. It is not intented to have a generic API, but I can improve it in a later time.
Assume inputs are represented as matrix, where:
each column is a data point
is the dimension of vector
is the number of points
Get Some Test Data Sets
Befor coding, we can generate some test data for later use. Following code randomly sample centrics in a region, then generate data points around centrics. It is easy to observe the square shape around the boundary, but for our purpose this doesn't matter.
#=
  get random point set represented as array of real numbers
    Attention: these parameters are only used to generate random points,
      they are not constraints on results!
    n: number of points to generate
    d: dimension of points
    r: radius around zero point
    k: number of groups (can't be guaranteed actually, just random generated)
    σ: deviation for points around k centers
=#

function get_random_points(n::Int64, d::Int64=2, r::Int64=4,
        k::Int64=2, σ::Float64=1.0)::Tuple{Array{Float64, 2}, Array{Float64, 2}}

    centroids = (rand(Float64, (d, k)) .-0.5) .* r
    deviations = rand(Float64, (d, n)) .* σ
    sub_count = floor(Int, n/k)
    for idx in 1:size(deviations)[2]
        deviations[:,idx] .+= centroids[:, min(ceil(Int, idx/sub_count), k)]
    end
    return deviations, centroids
end
The Algorithm
The algorithm is actually not long. Given matrix of as point set, where is the dimension of data, is the number of points. Also provides how many clusters we want to get, e.g. .
The algoritm first randomly pick centroids and assign each point to a cluster, then it iterates as following:
update the cluster assignment
for each point, calculate its distance to all centroids
find the cloest centroid, assign the point to that cluster
update the centroids
for every centroid, calculate its possition using the latest points assigned to it
The iteration stopes when the assignment does not change between two iterations, or reaches a limit.
function k_means_clustering(points::Array{Float64, 2}, k::Int)::Array{Int64,1}
    new_tags = rand(1:k,size(points)[2])
    old_tags = zeros(Int64, k)
    centroids = rand(Float64, (size(points)[1], k))
    iterations = 0
    while new_tags != old_tags && iterations < 5000
        iterations += 1
        old_tags = copy(new_tags)
        for i in 1:size(points)[2]
            new_tags[i] = argmin(sqrt.(sum((centroids .- points[:,i]).^2, dims=1)))[2]
        end
        for i in 1:k
            centroids[:, i] = sum(points[:, new_tags .== i], dims=2)/
                size(findall(x->x==i, new_tags))[1]
        end
    end
    return new_tags
end
Test
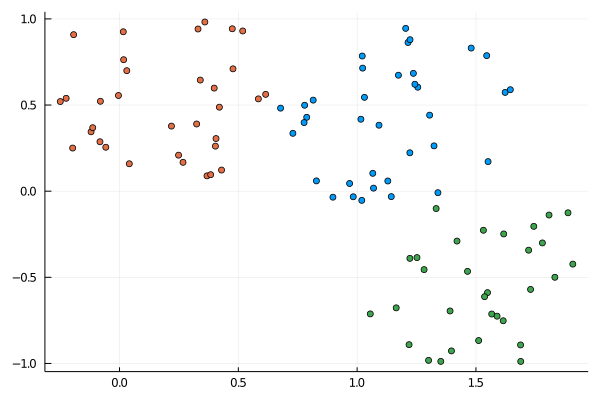
Running aboved defined functions we can generate data then clustering it. The results are ploted:
points, centroids = get_random_points(100, 2, 2, 3)
tags = k_means_clustering(points, 3)
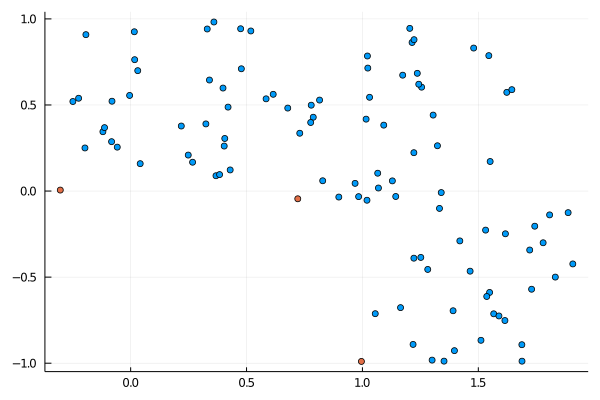
Points before clustering. The 3 red points are the random base points when generating the point set.

Points clustered and assigned with colors.